This site uses cookies to provide you with a great user experience. By visiting monetamarkets.com, you accept our cookie policy.
Allow allThis site uses cookies to provide you with a great user experience. By visiting monetamarkets.com, you accept our cookie policy.
Allow all
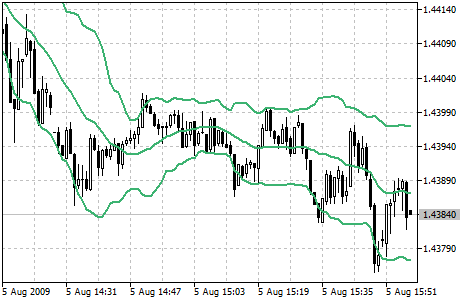
Bollinger Bands are a technical analysis tool that traders use to identify potential buying and selling opportunities in the financial markets. The Bollinger Bands are composed of a moving average and two bands that are placed above and below the moving average. The bands are typically set two standard deviations above and below the moving average, but this can be customized depending on the trader’s preferences and the specific market conditions.
Traders typically use Bollinger Bands to identify potential buying and selling opportunities based on overbought and oversold conditions. For example, if the price of a stock is approaching the upper band, it may be considered overbought and may be due for a pullback or correction. On the other hand, if the price is approaching the lower band, it may be considered oversold and may be due for a bounce or rally. Traders can also use Bollinger Bands to confirm the strength of a trend or to identify potential trend reversals. For example, if the bands are widening, it may indicate that the market is becoming more volatile and that a trend reversal is possible.
To add Bollinger Bands to a chart in MetaTrader 4 (MT4) or MetaTrader 5 (MT5), follow these steps: