This site uses cookies to provide you with a great user experience. By visiting monetamarkets.com, you accept our cookie policy.
Allow allThis site uses cookies to provide you with a great user experience. By visiting monetamarkets.com, you accept our cookie policy.
Allow allThis website is operated by Moneta Markets Ltd, which is not authorised or regulated by the UK Financial Conduct Authority (FCA) and does not offer or promote services to UK residents. Access to this website is restricted in the UK and the content is not intended for distribution to, or use by, any person located in the UK. If you believe you have reached this website in error, please exit the page now

Please note that Moneta Markets operates this website and its services are not directed at residents of your jurisdiction.
The information on this site is not intended for distribution to, or use by, any person in any country or jurisdiction where such distribution or use would be contrary to local law or regulation.
If you have arrived here in error, we kindly advise you to exit the site.
Continue to Site

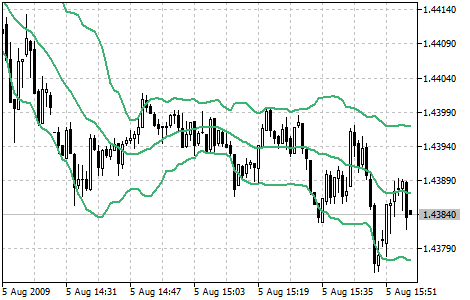
Bollinger Bands are a technical analysis tool that traders use to identify potential buying and selling opportunities in the financial markets. The Bollinger Bands are composed of a moving average and two bands that are placed above and below the moving average. The bands are typically set two standard deviations above and below the moving average, but this can be customized depending on the trader’s preferences and the specific market conditions.
Traders typically use Bollinger Bands to identify potential buying and selling opportunities based on overbought and oversold conditions. For example, if the price of a stock is approaching the upper band, it may be considered overbought and may be due for a pullback or correction. On the other hand, if the price is approaching the lower band, it may be considered oversold and may be due for a bounce or rally. Traders can also use Bollinger Bands to confirm the strength of a trend or to identify potential trend reversals. For example, if the bands are widening, it may indicate that the market is becoming more volatile and that a trend reversal is possible.
To add Bollinger Bands to a chart in MetaTrader 4 (MT4) or MetaTrader 5 (MT5), follow these steps: